
The Scattered Information Problem
Investing today means living in browser-tab chaos.
You check the FRED website for inflation data, open Yahoo Finance to see your portfolio, flip to TradingView for charts, and search Google News for company updates. Then maybe you ask ChatGPT to explain what it all means.
By the time you’ve pieced everything together, markets have moved — and the connection between macro data, stock behavior, and news headlines is lost.
This fragmentation doesn’t just waste time. It hides the bigger picture. Economic trends that should inform portfolio decisions get buried across different sites. News that could explain a stock’s movement arrives out of context.
YayData was built to fix that.
One Platform, One Mental Model
YayData consolidates the signals that actually move your investments — macro indicators, real-time portfolio performance, stock news, and AI-driven context — into one clean interface.
You can open it once and instantly answer the question every investor asks:
What’s happening with my portfolio — and why?
The Macro Dashboard
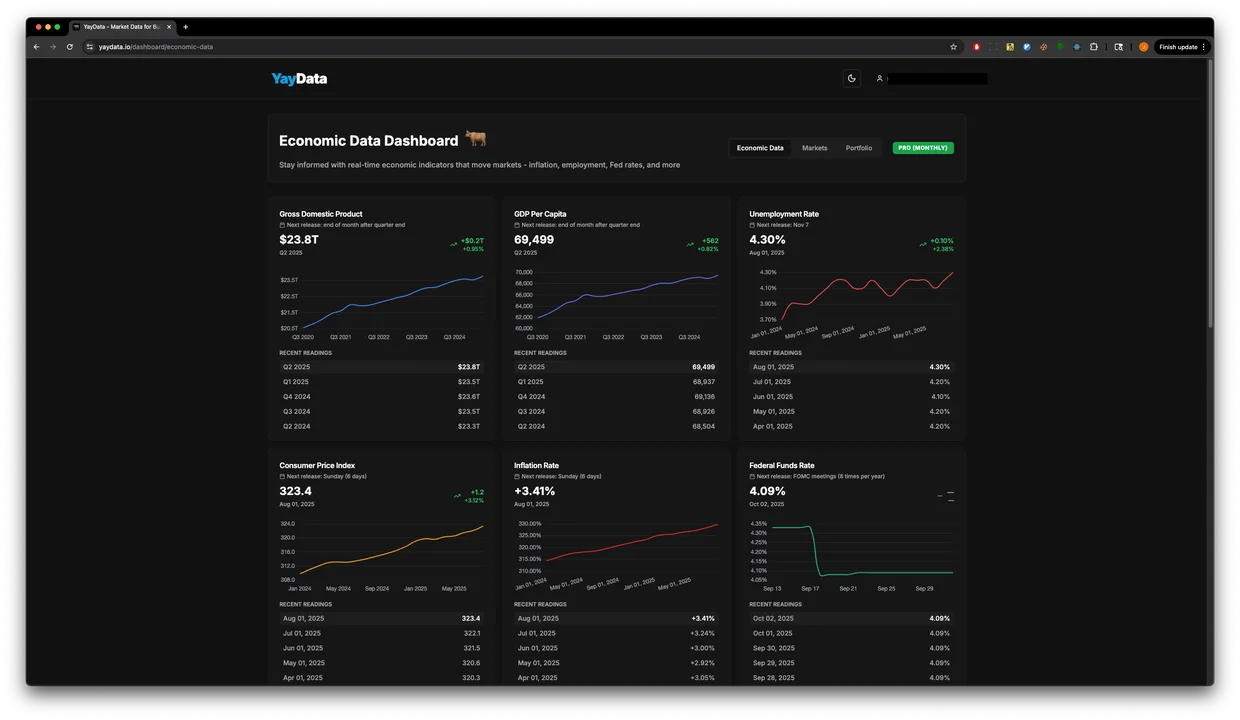
Understanding the economic backdrop shouldn’t require a degree in economics.
YayData distills the essentials into a single, scannable view:
- Inflation, GDP, and Unemployment — see the health of the economy at a glance
- Interest Rates and Treasury Yields — track how policy shifts impact markets
- Consumer and Business Indicators — retail sales, durable goods, sentiment, and more
Each metric includes current values, trend charts, and upcoming release dates, so you can quickly spot turning points instead of hunting for them across multiple data sources.
Now you can easily assess whether we're heading into a slowdown without needing to become an economist.
The Portfolio Dashboard
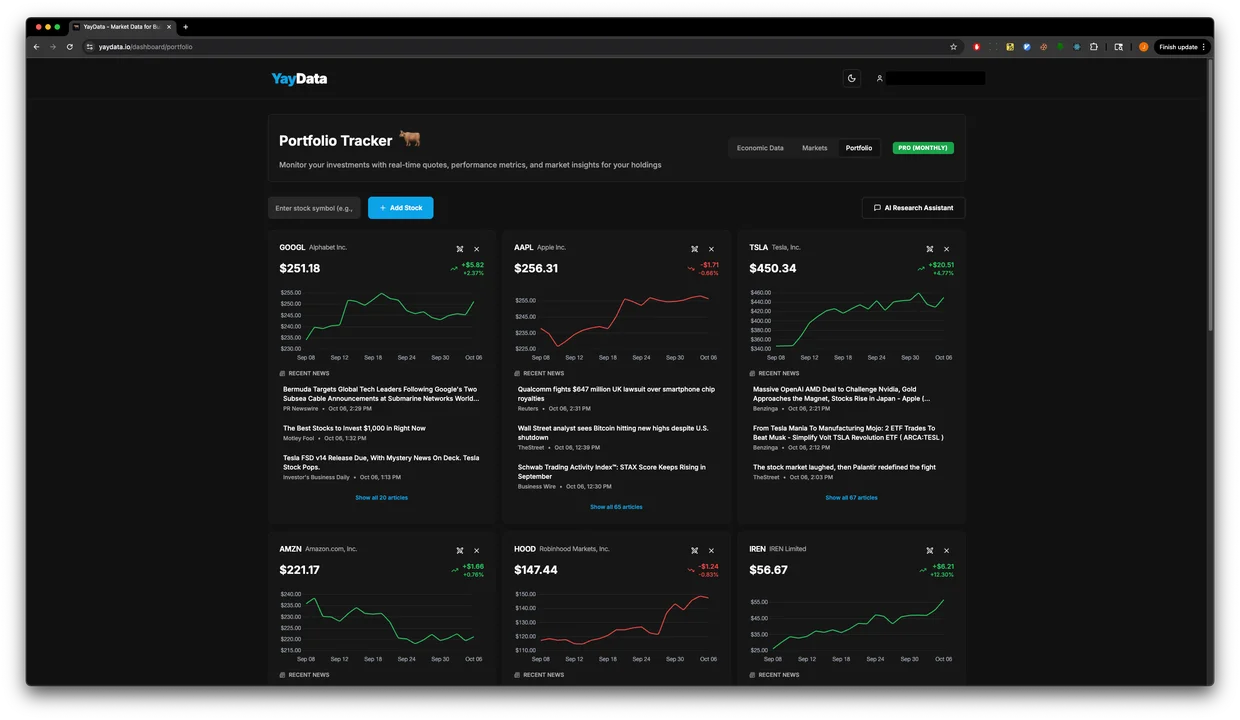
The heartbeat of YayData is your portfolio — updated in real time and enriched with context.
- Live quotes for all your holdings
- Aggregated news feeds that pull from multiple reputable sources
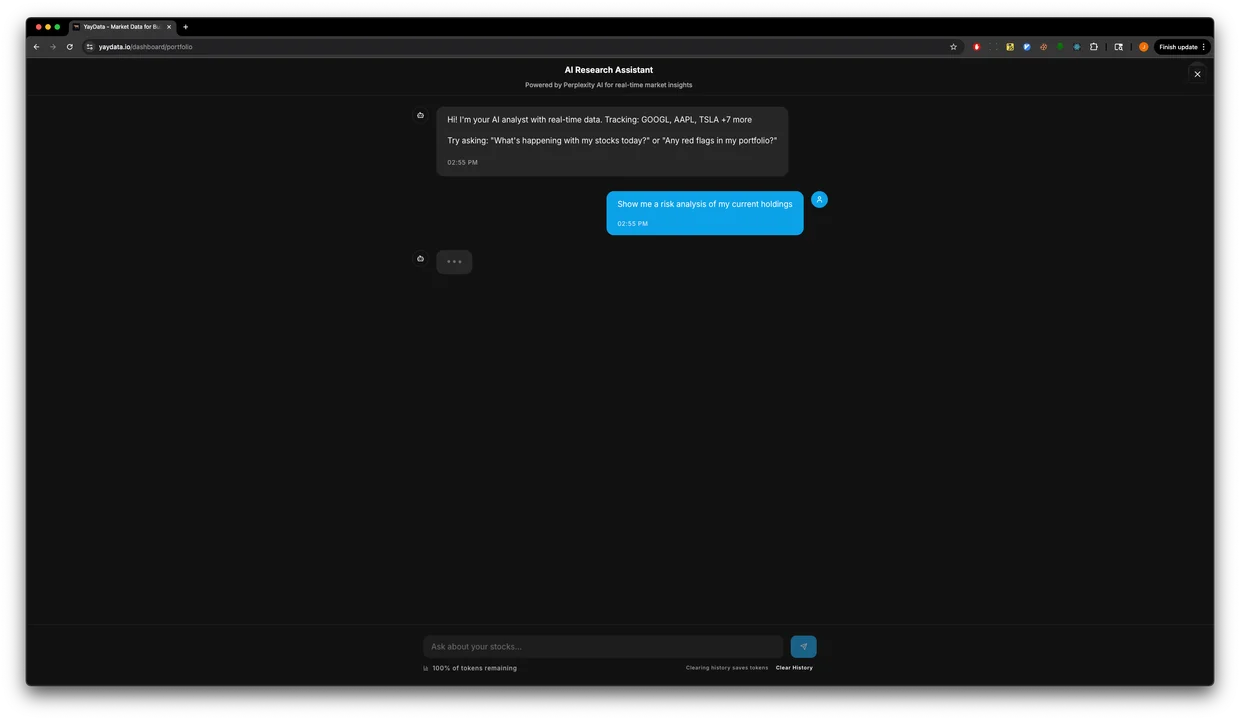
- AI insight engine that can answer questions like:
- “Why is this stock down today?”
- “What’s driving my portfolio’s move?”
- “How might rising rates affect my tech holdings?”
Instead of manually Googling each ticker, you get concise explanations tailored to your positions.
Just ask YayData: “My portfolio dropped 3% today — is that noise or something deeper?”
Battle Room: Deep Context, No Tab Chaos
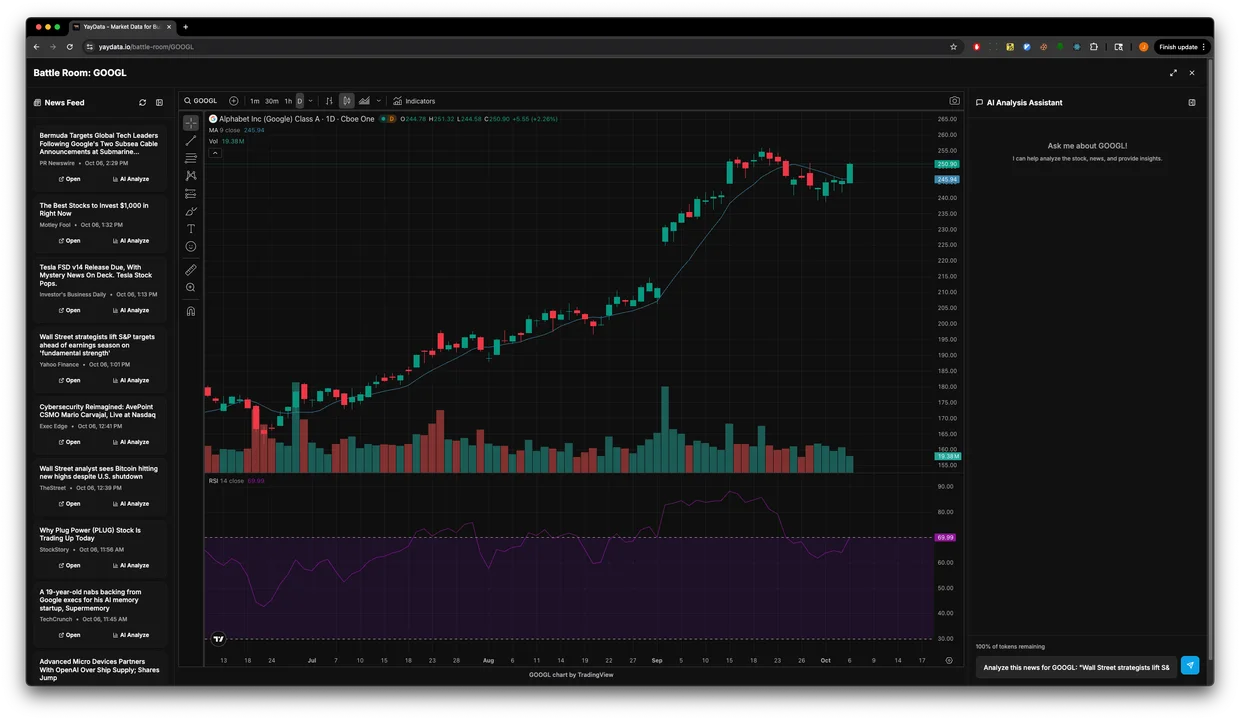
When a particular stock demands your attention, Battle Room provides everything you need to analyze it — news, charts, and intelligent context — on one screen.
- Left pane: Real-time news aggregation for that stock
- Center: TradingView-powered charts and quick article summaries
- Right pane: An AI assistant aware of the stock’s metrics, the article you’re viewing, and recent headlines
You can ask:
What are the long-term implications of this news?
and get a response grounded in actual data and market behavior — not a generic take. All without opening ten new tabs or losing your train of thought.
Built for How Investors Actually Think
Investment decisions don’t happen in isolation:
- Macroeconomics influence market direction
- News drives price reactions
- Context turns data into insight
- Time is limited
YayData connects these dots.
Inflation trends help explain portfolio swings. Economic calendars reveal what might move markets next. And the AI assistant ties it all together, so you understand not just what happened — but why.
The Bottom Line
YayData isn’t another finance dashboard. It’s a clarity engine.
By bringing economic data, real-time market updates, portfolio tracking, and contextual AI into one cohesive interface, it removes the friction of modern investing.
If you’ve ever stared at your portfolio wondering what’s really going on, YayData gives you the answer — clearly, instantly, and all in one place.
Comments (0)
Please sign in to comment